Projects Dashboard
The operational hub for reviewing, rating, collaborating on, and building from your generated use cases.
Project Dashboard
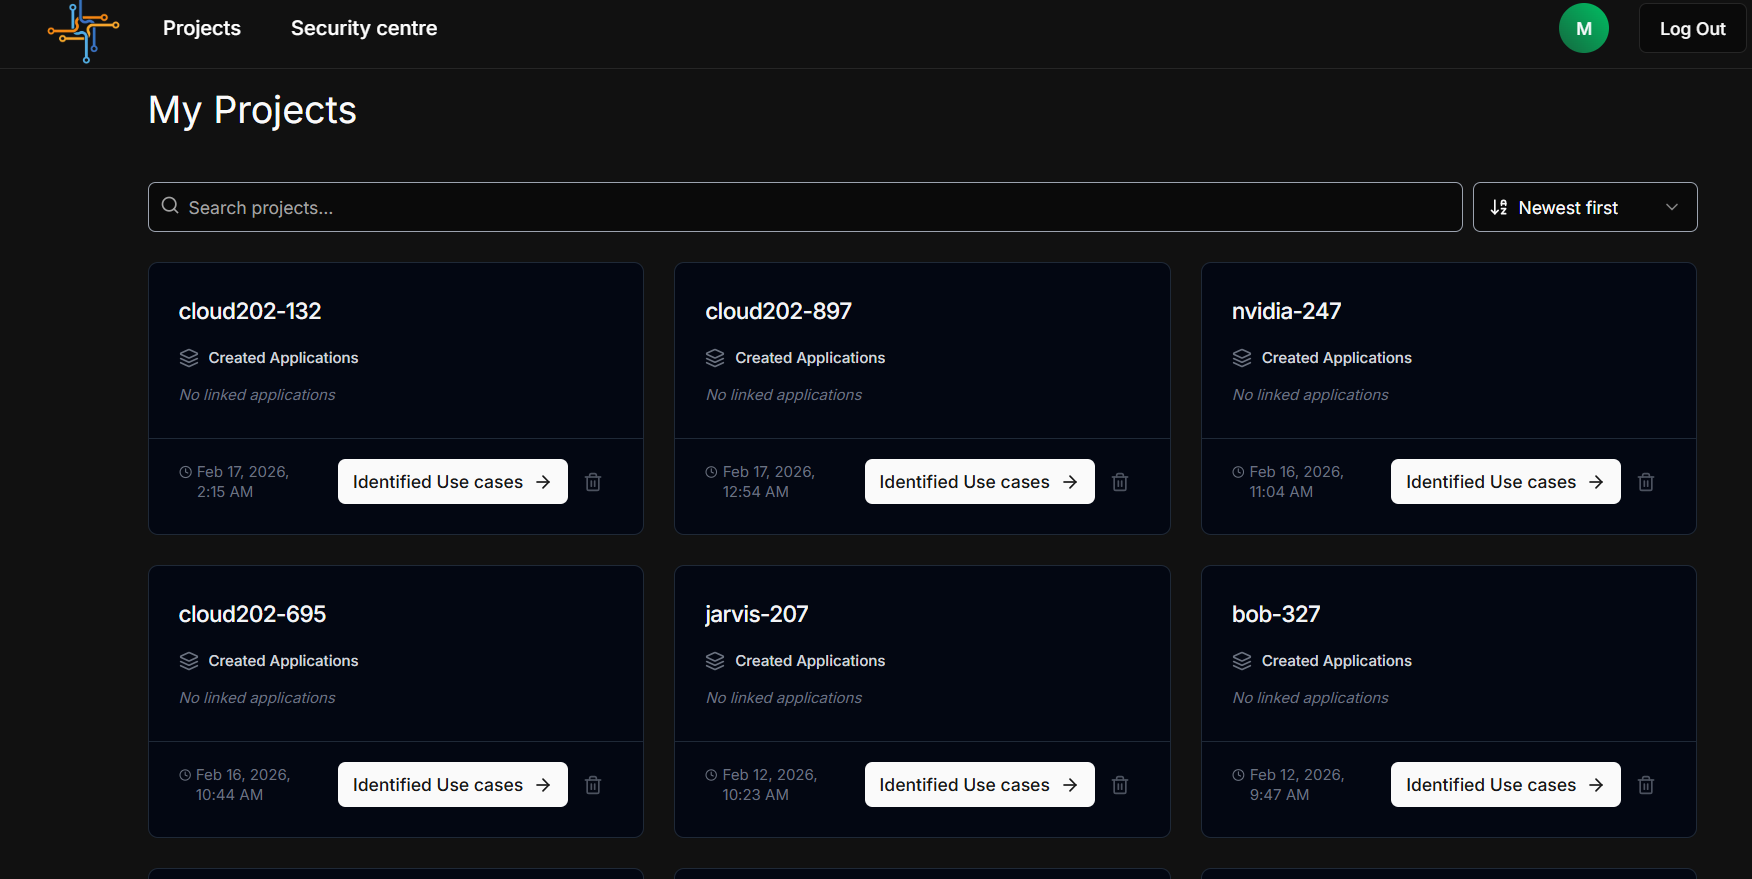
After analysis completes and the project is saved, clicking into My Projects opens the Project Dashboard -- the operational hub for reviewing, rating, collaborating on, and building from your generated use cases.
Dashboard Layout
The Project Dashboard is the operational hub for a completed analysis project. It is accessible via My Projects on the Project Selection page.
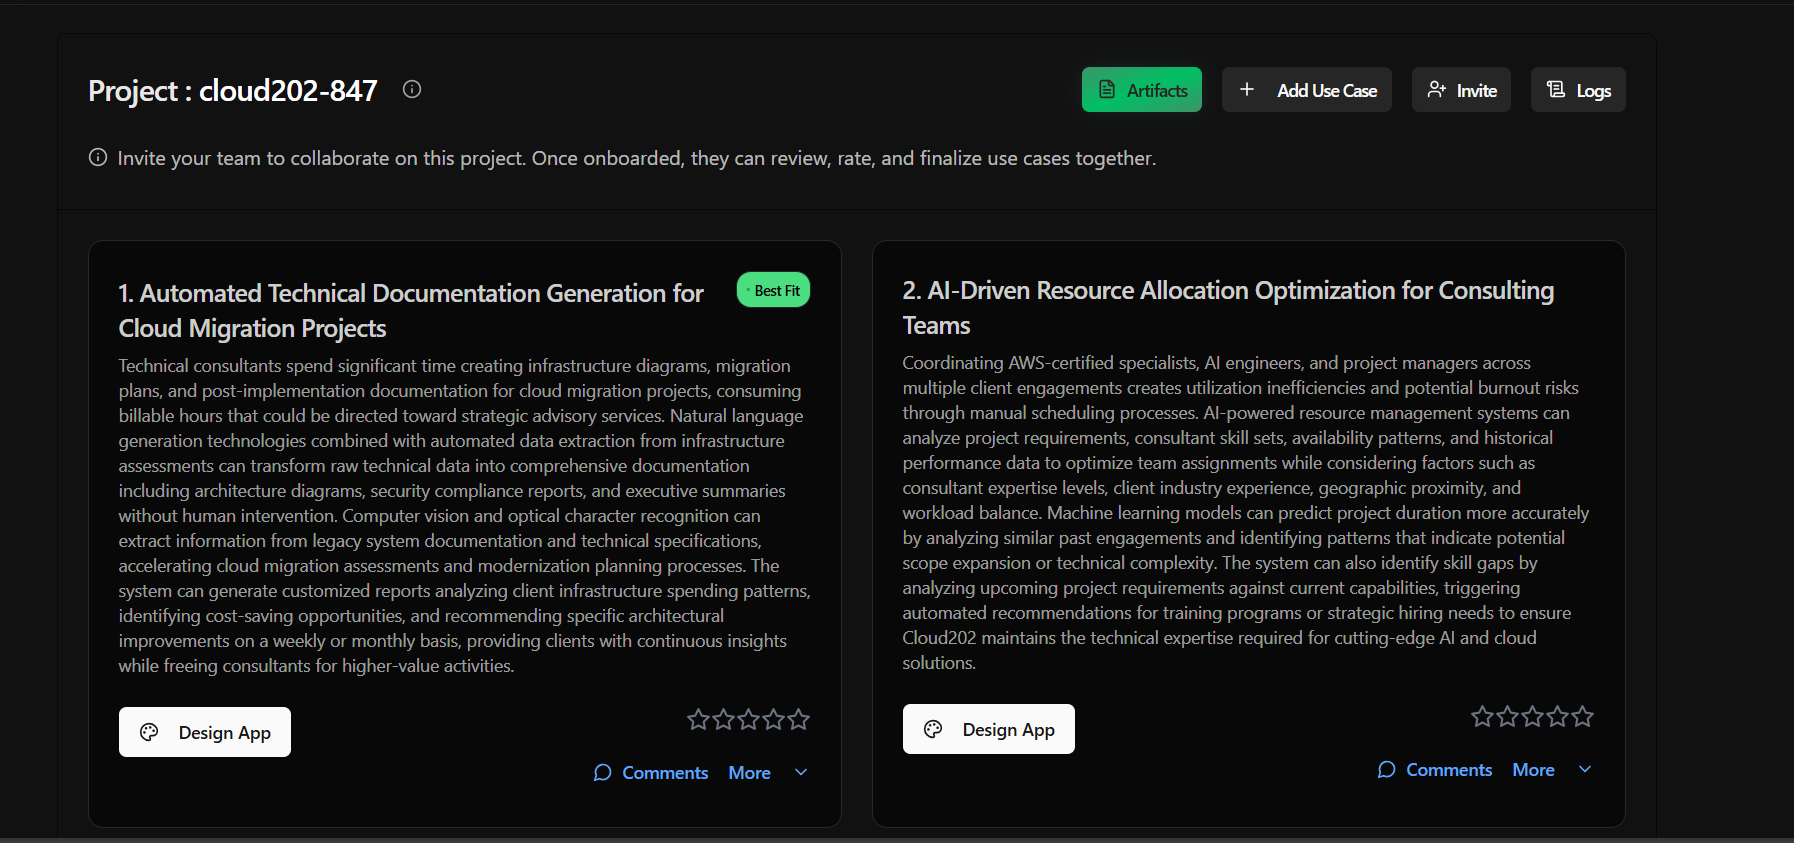
Header Bar
| Element | Position | Description |
|---|---|---|
| Project Title | Left | "Project : project-id" with info tooltip (i) |
| Artifacts Button | Right | Green button -- opens the Artifacts panel |
| + Add Use Case | Right | Manually add custom use cases to the project |
| Invite | Right | Invite team members to collaborate |
| Logs | Right | View the full pipeline Connection Log |